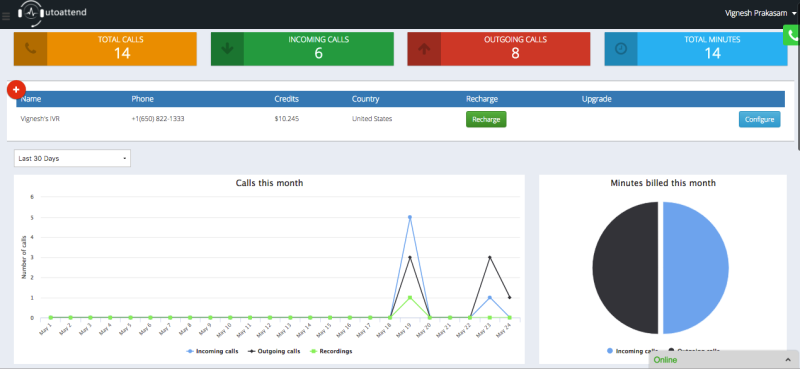
We are listing down all the historical data on the top strip – Total calls, incoming calls, outgoing calls and total billed minutes. These numbers tell you the data from day one when you started using our service.
Below it we display calls received , dialed out and recorded this month. For this graph, you can filter for the current week or the current month. Next to it we show the total minutes billed for the month in a pie chart.
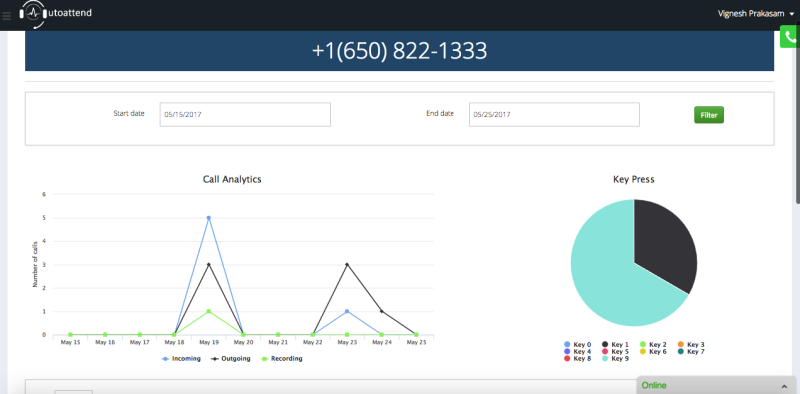
If you would like to see a break up of calls received for previous months or a custom date range, head over to the analytics section. In addition to calls count, you get to see which key the caller often presses when he reaches your IVR.


